this post was submitted on 07 May 2025
430 points (100.0% liked)
Climate - truthful information about climate, related activism and politics.
6518 readers
323 users here now
Discussion of climate, how it is changing, activism around that, the politics, and the energy systems change we need in order to stabilize things.
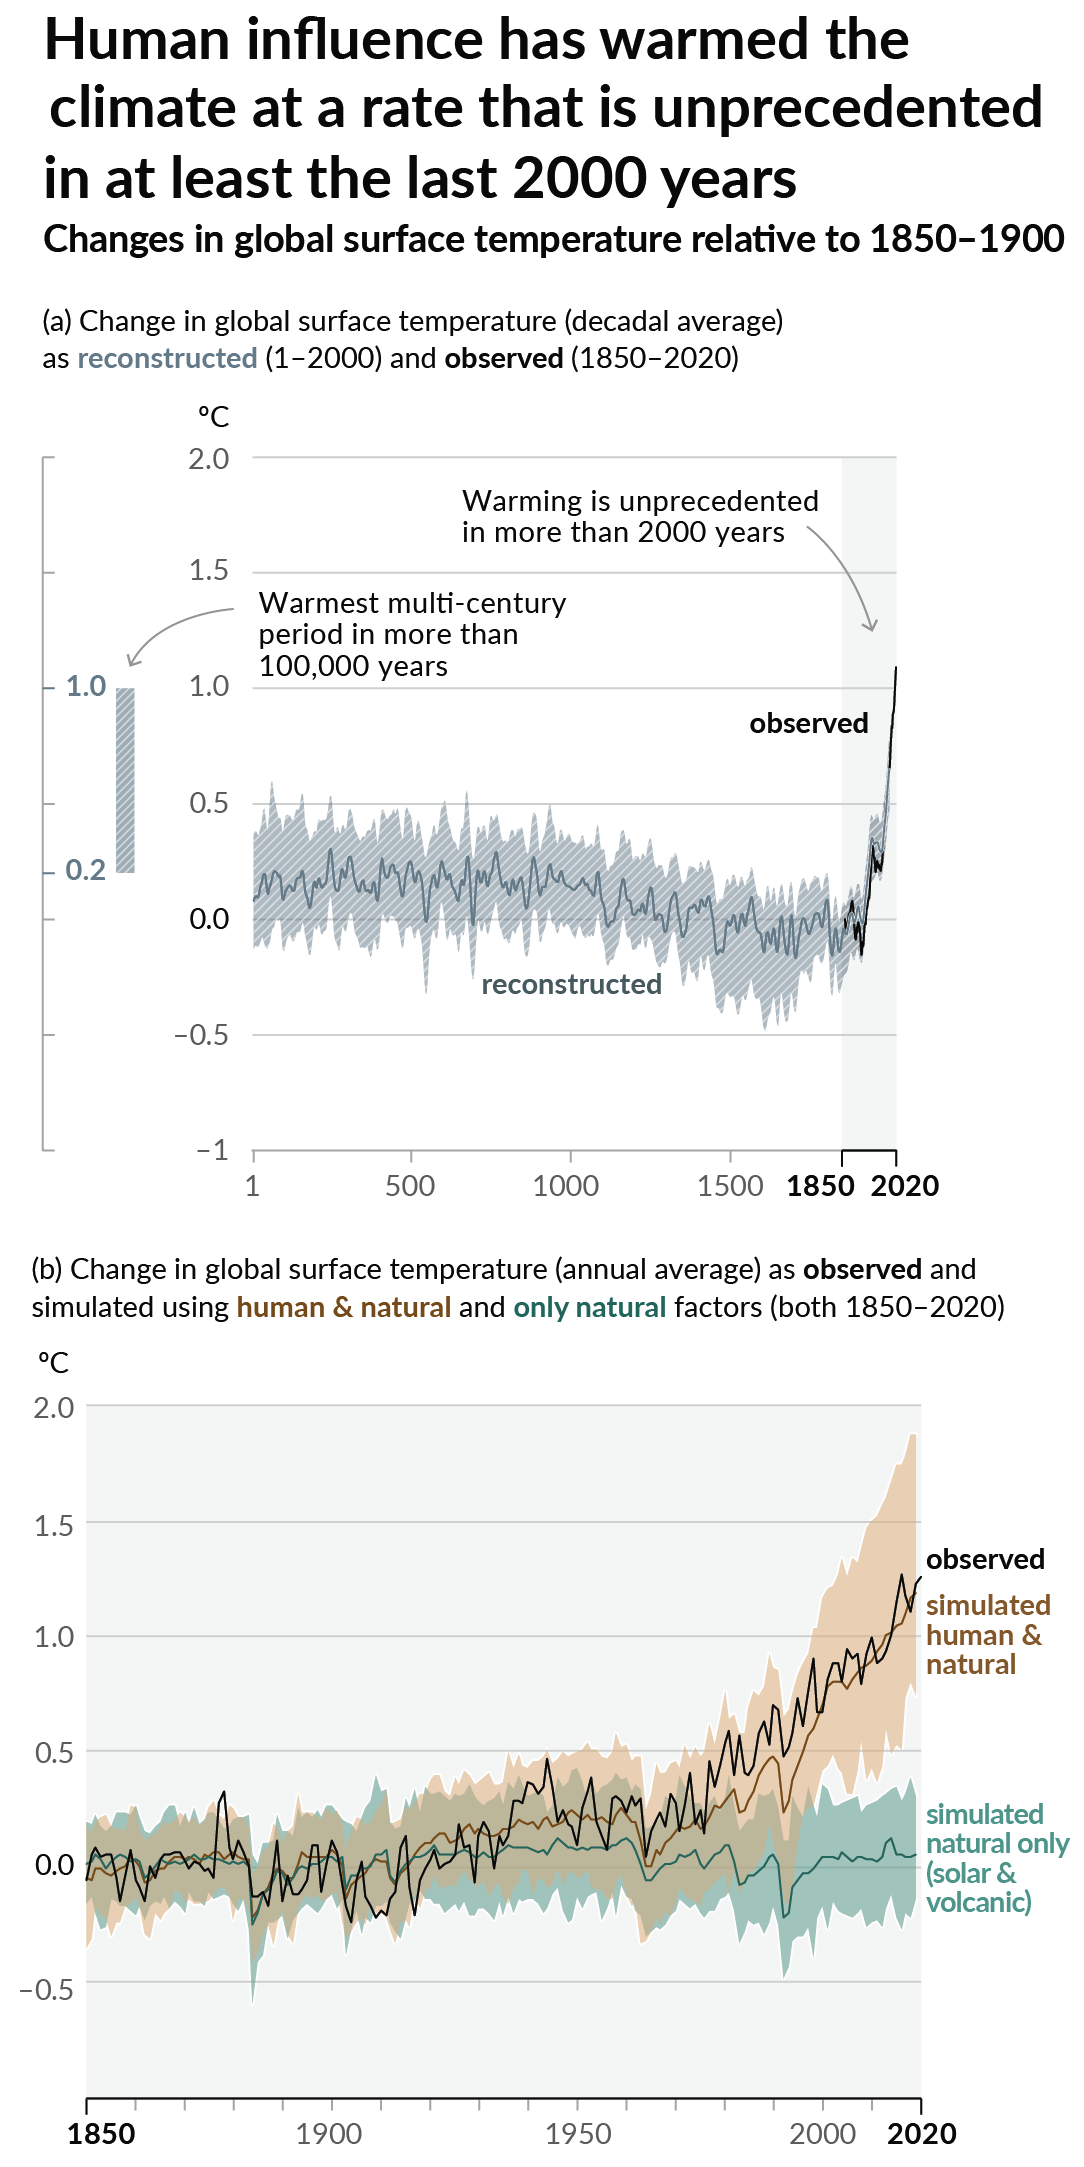
As a starting point, the burning of fossil fuels, and to a lesser extent deforestation and release of methane are responsible for the warming in recent decades:
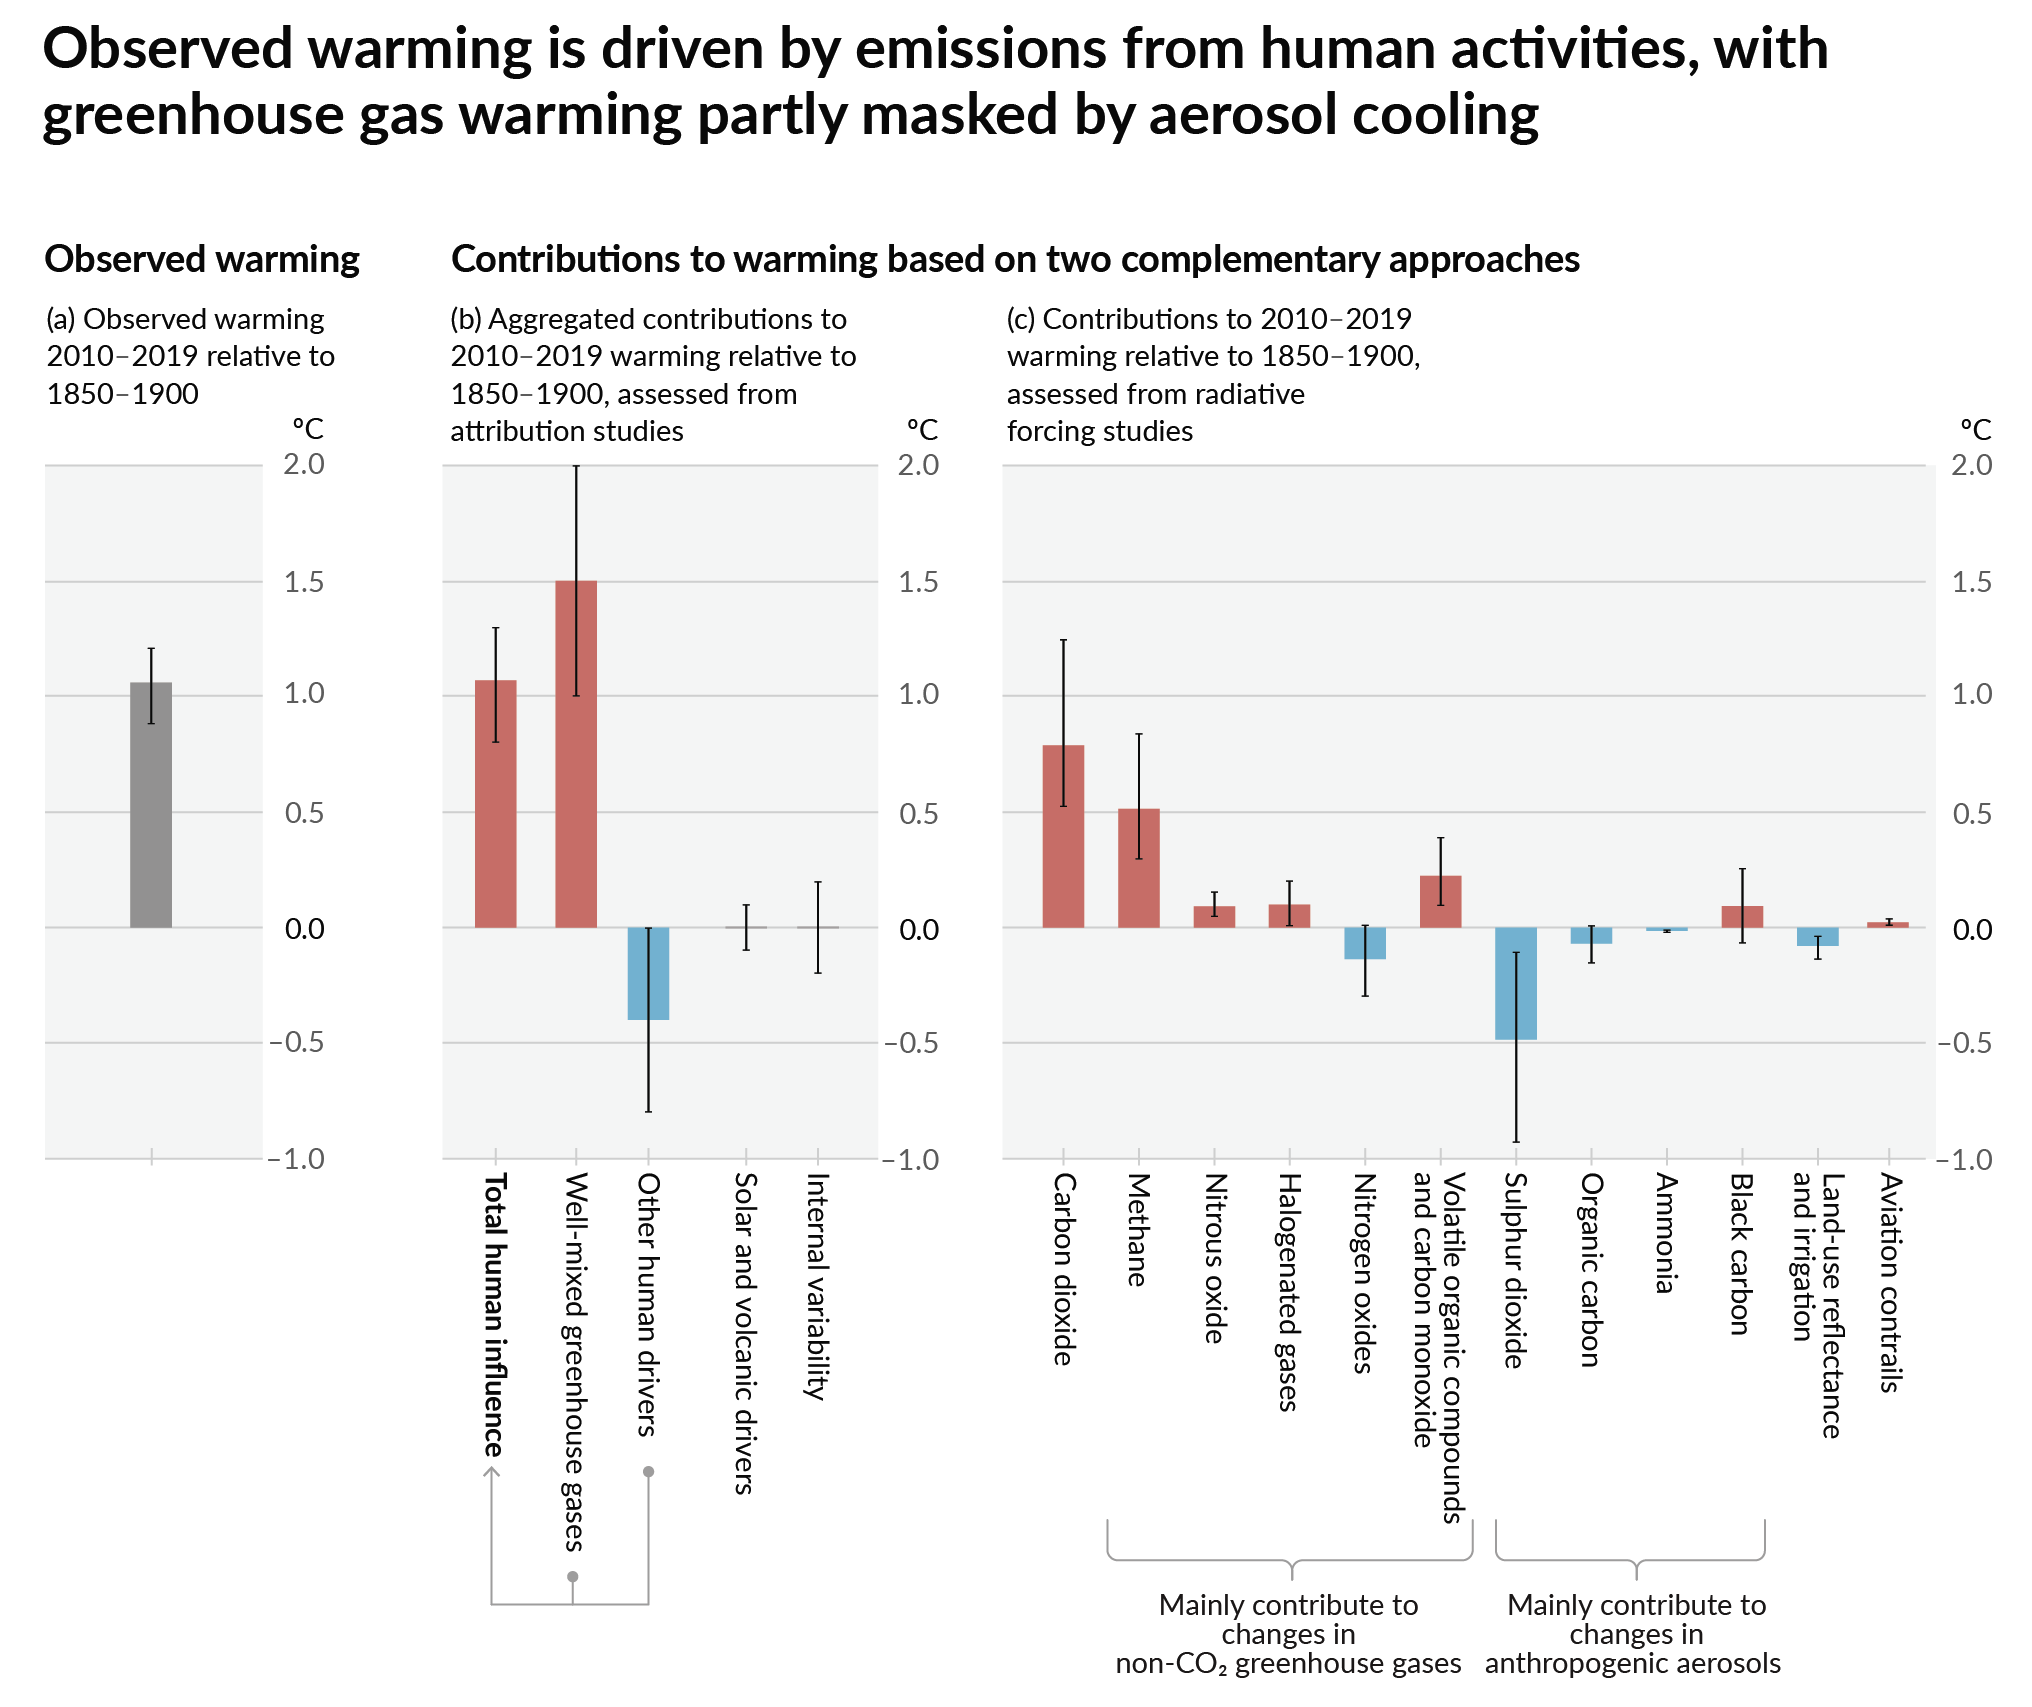
How much each change to the atmosphere has warmed the world:
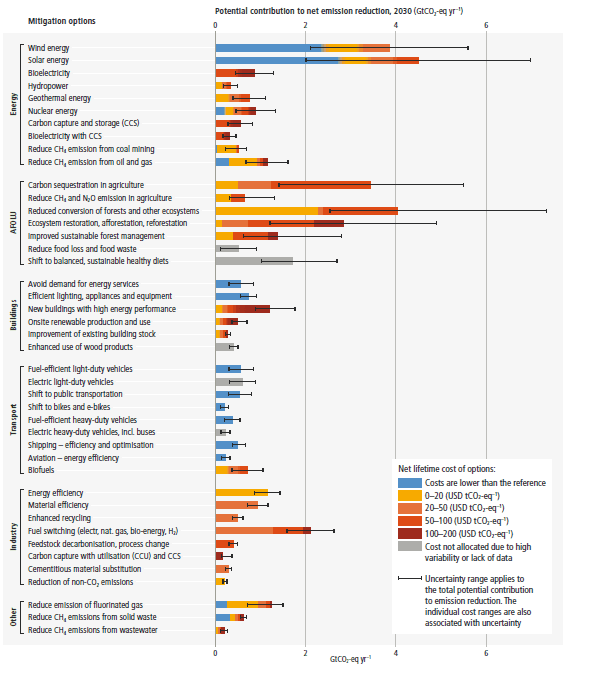
Recommended actions to cut greenhouse gas emissions in the near future:
Anti-science, inactivism, and unsupported conspiracy theories are not ok here.
founded 2 years ago
MODERATORS
you are viewing a single comment's thread
view the rest of the comments
view the rest of the comments
For anyone wondering, the wealthiest top 1% alone accounts for one-fifth of warming.
Link to original study: https://www.nature.com/articles/s41558-025-02325-x
Full abstract:
Spoiler
Climate injustice persists as those least responsible often bear the greatest impacts, both between and within countries. Here we show how GHG emissions from consumption and investments attributable to the wealthiest population groups have disproportionately influenced present-day climate change. We link emissions inequality over the period 1990–2020 to regional climate extremes using an emulator-based framework. We find that two-thirds (one-fifth) of warming is attributable to the wealthiest 10% (1%), meaning that individual contributions are 6.5 (20) times the average per capita contribution. For extreme events, the top 10% (1%) contributed 7 (26) times the average to increases in monthly 1-in-100-year heat extremes globally and 6 (17) times more to Amazon droughts. Emissions from the wealthiest 10% in the United States and China led to a two- to threefold increase in heat extremes across vulnerable regions. Quantifying the link between wealth disparities and climate impacts can assist in the discourse on climate equity and justice.That's huge. That means that if you're in the tenth percentile of income/emissions, you might well be emitting less than the global average.
I say this because it's true if you make the assumption of exponential decay. Their data isn't accurate enough to check that assumption, but it's the most parsimonious one, and in this case the function that fits would be:
Where E is the emission fraction and P is the percentile as an integer. This results in the table below, with the numbers in bold the ones that the function is fit to.
Since a percentile is 1% wide, an emission fraction of 0.8% is below the global average.
This assumption doesn't fit with the remaining 90% of the population, but it makes sense that the exponential relationship would slow down as people maintain a "poverty line" minimum footprint. If this consideration already affects the 10th percentile, it's possible the 10th percentile still emits more than the global average.