this post was submitted on 03 Mar 2024
400 points (100.0% liked)
Climate - truthful information about climate, related activism and politics.
6940 readers
401 users here now
Discussion of climate, how it is changing, activism around that, the politics, and the energy systems change we need in order to stabilize things.
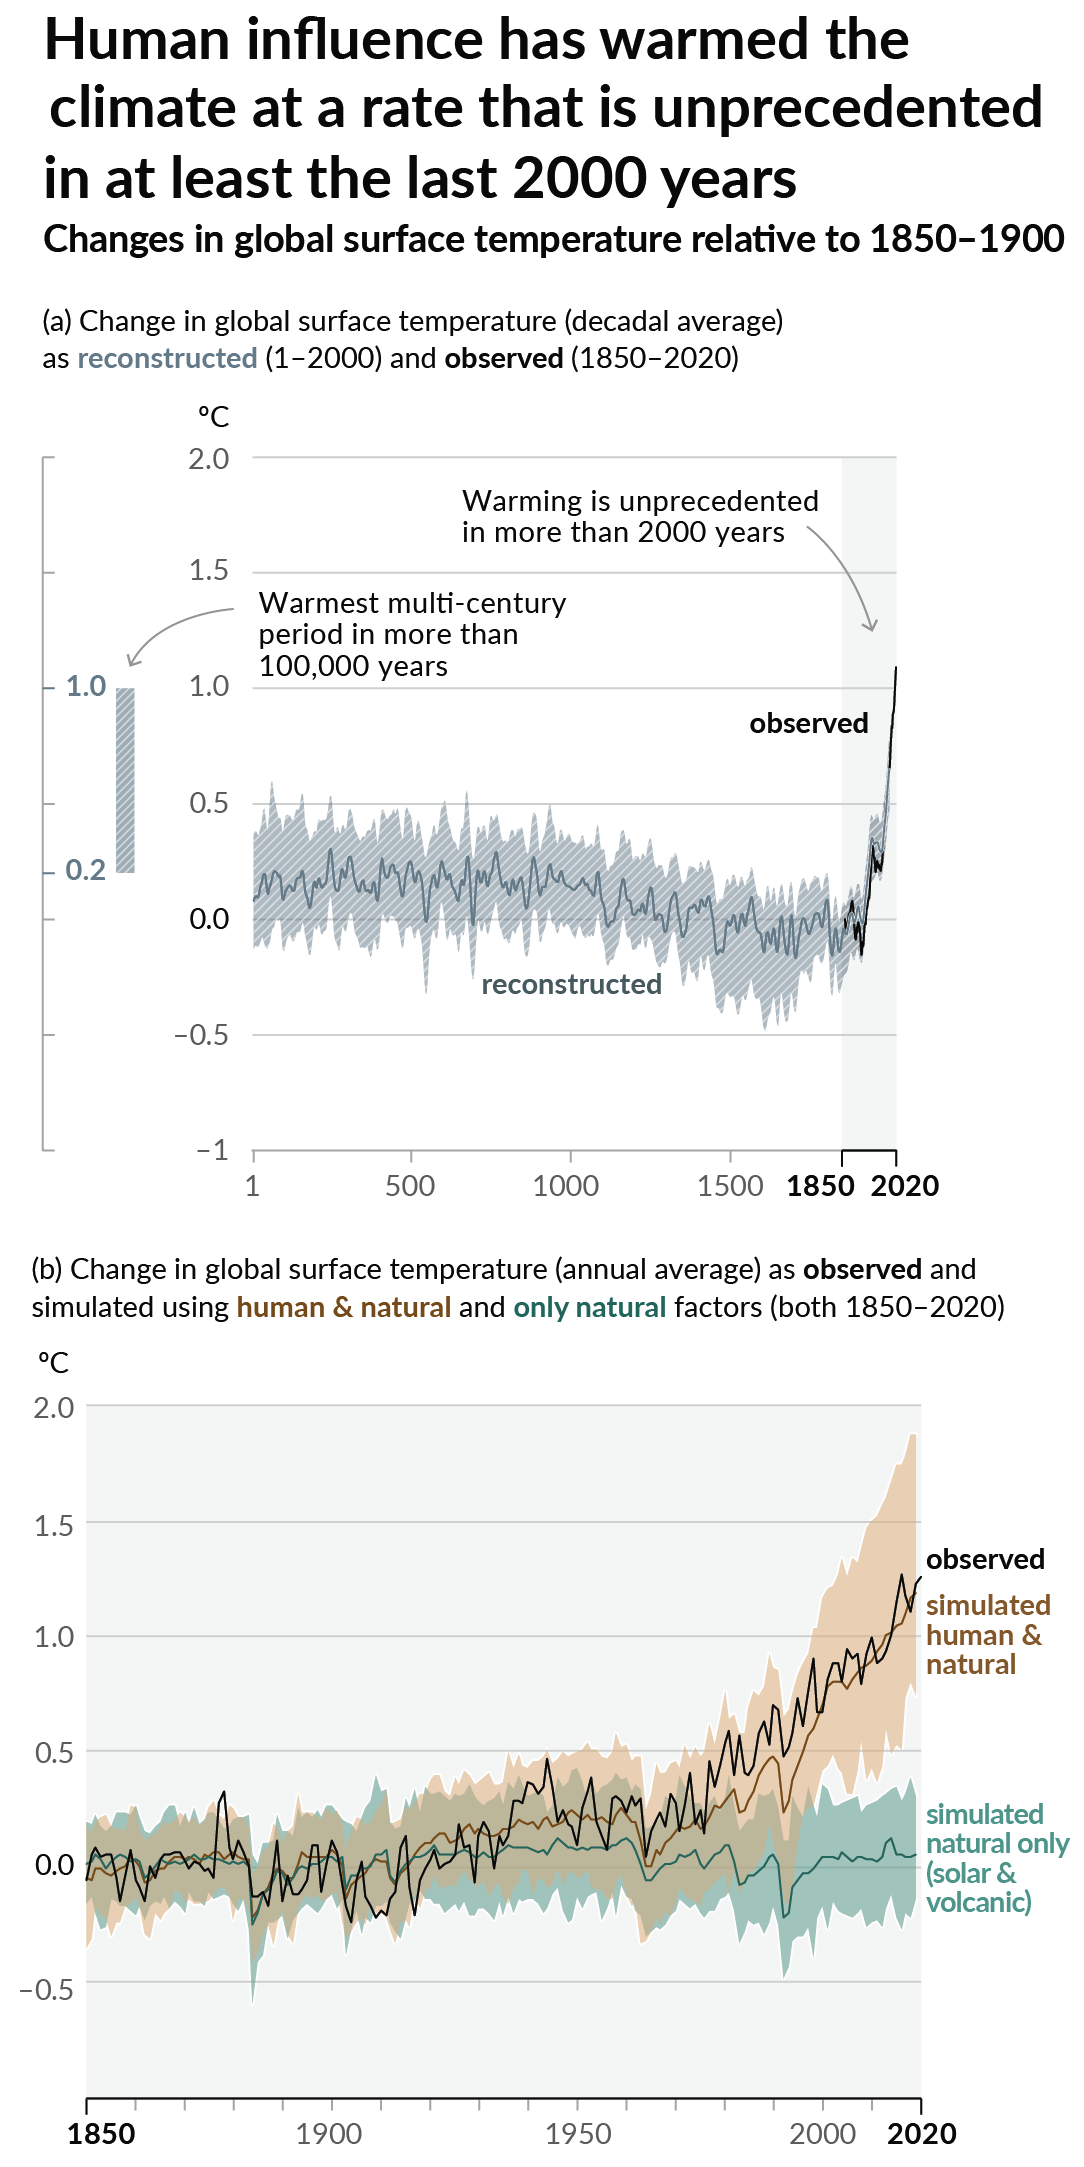
As a starting point, the burning of fossil fuels, and to a lesser extent deforestation and release of methane are responsible for the warming in recent decades:
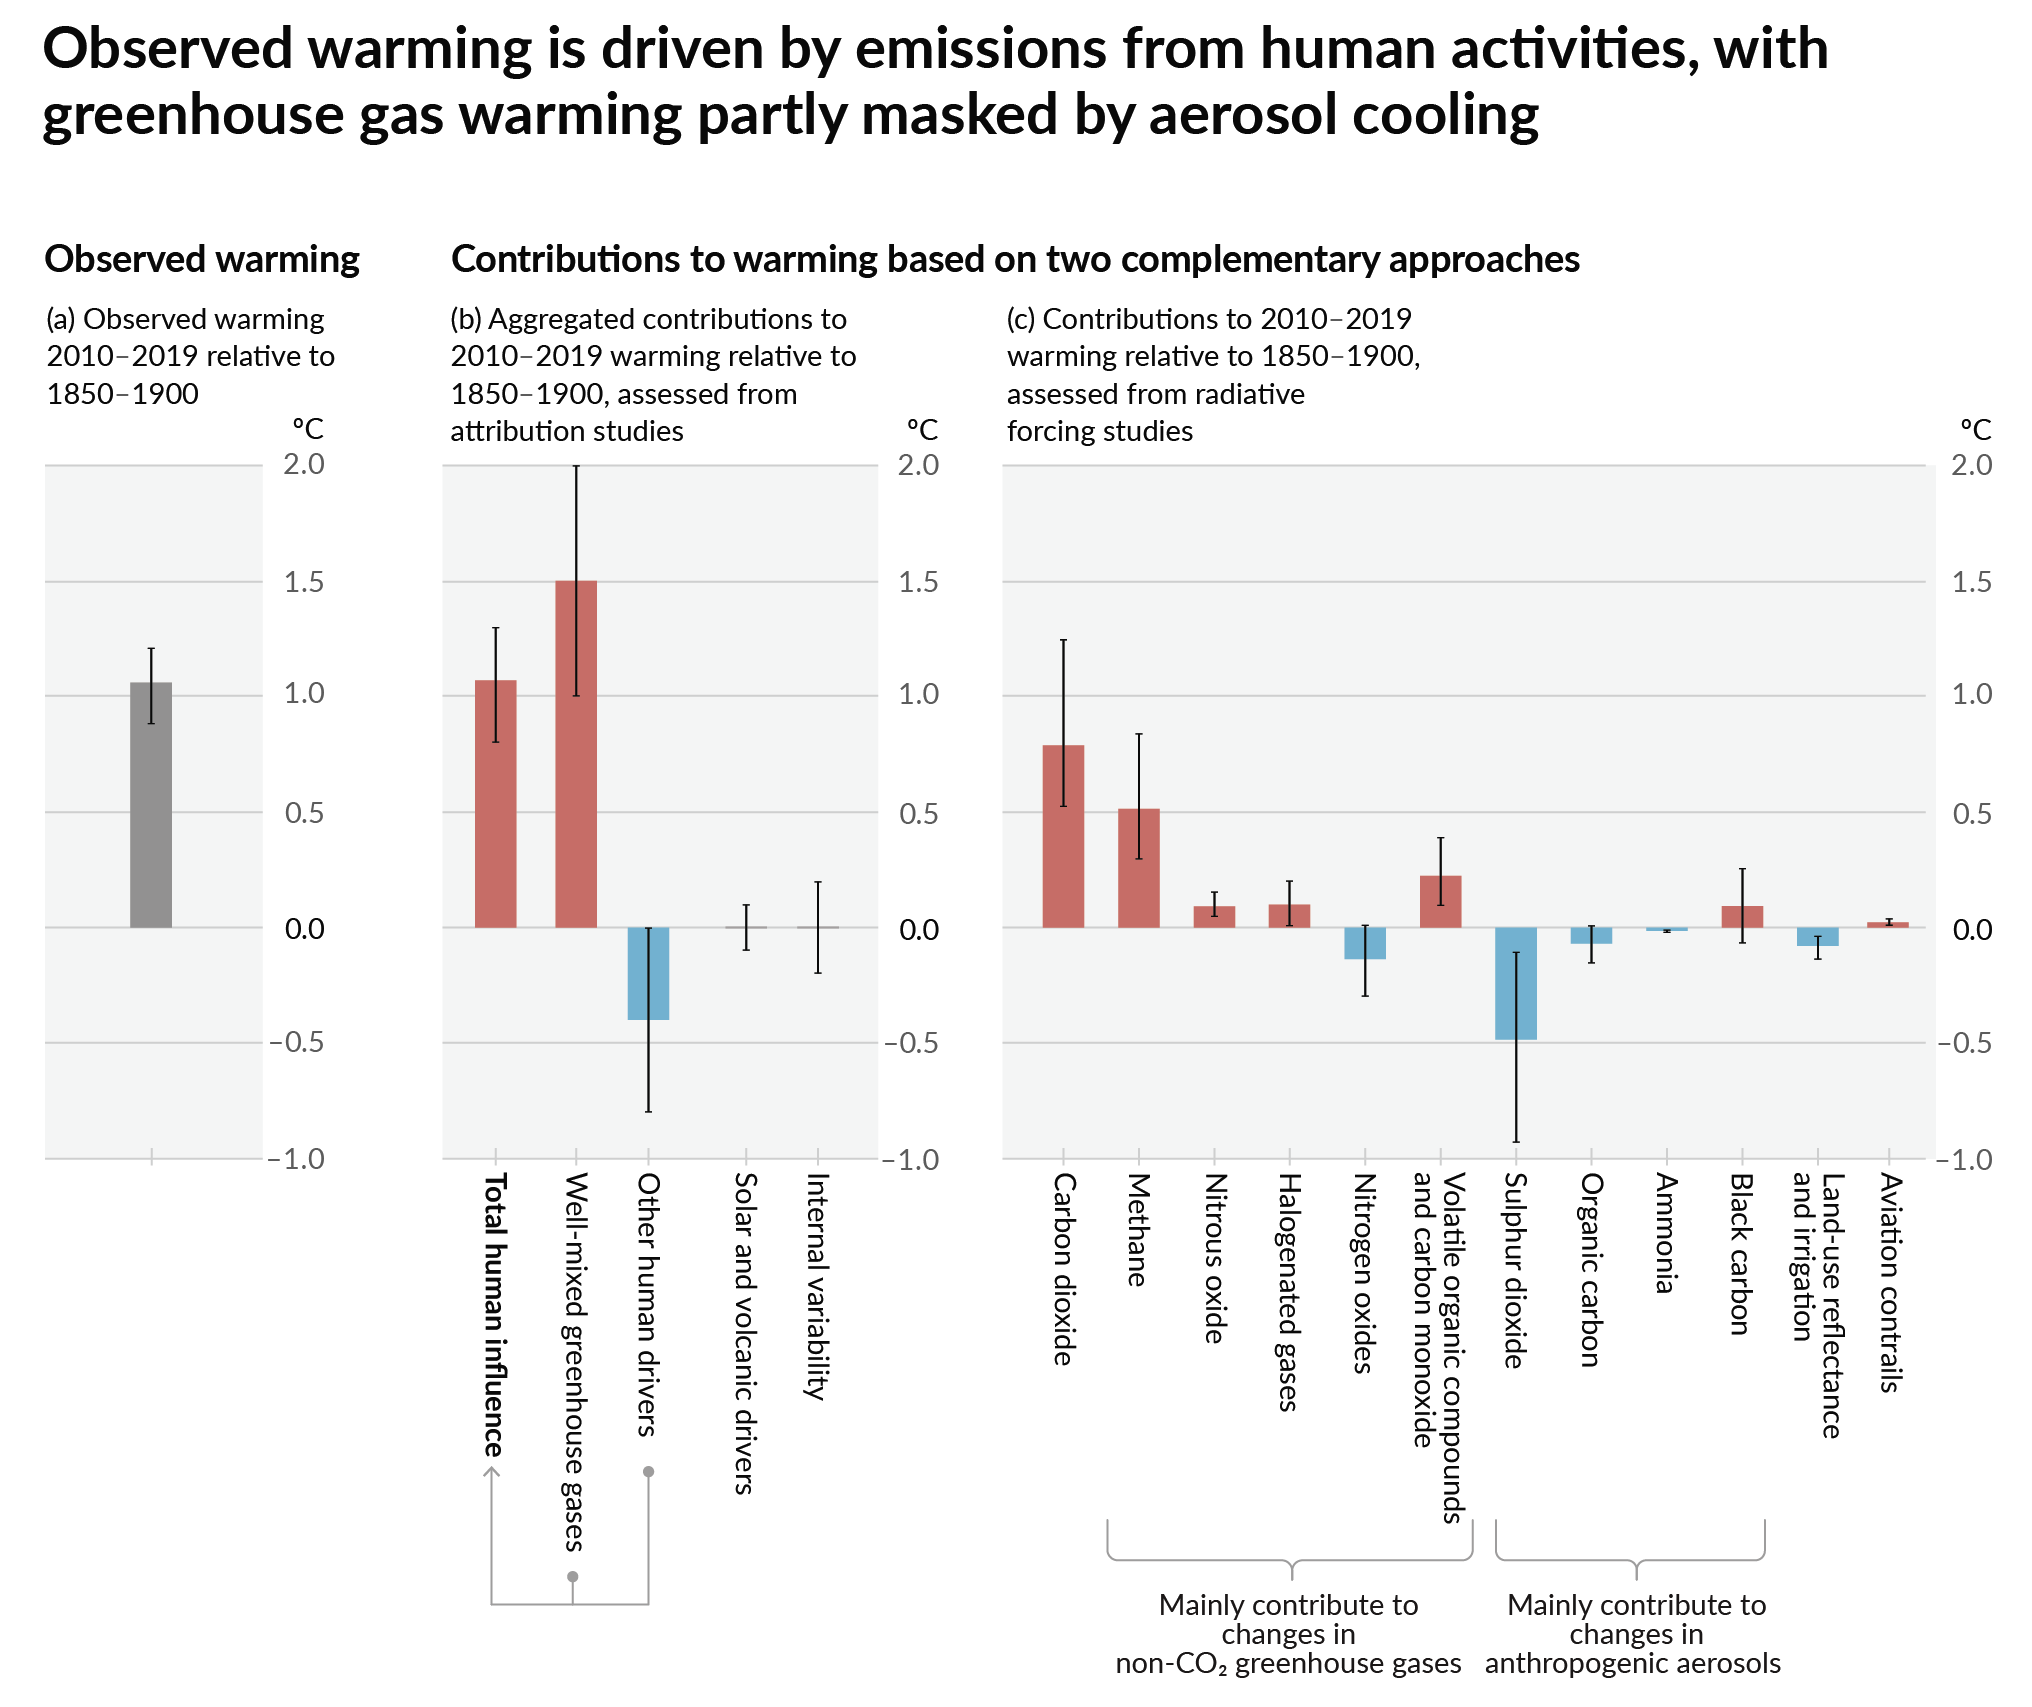
How much each change to the atmosphere has warmed the world:
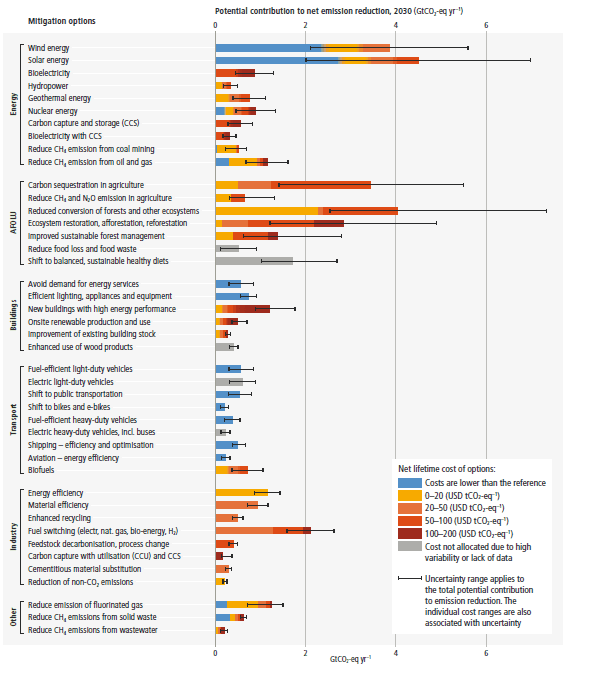
Recommended actions to cut greenhouse gas emissions in the near future:
Anti-science, inactivism, and unsupported conspiracy theories are not ok here.
founded 2 years ago
MODERATORS
you are viewing a single comment's thread
view the rest of the comments
view the rest of the comments
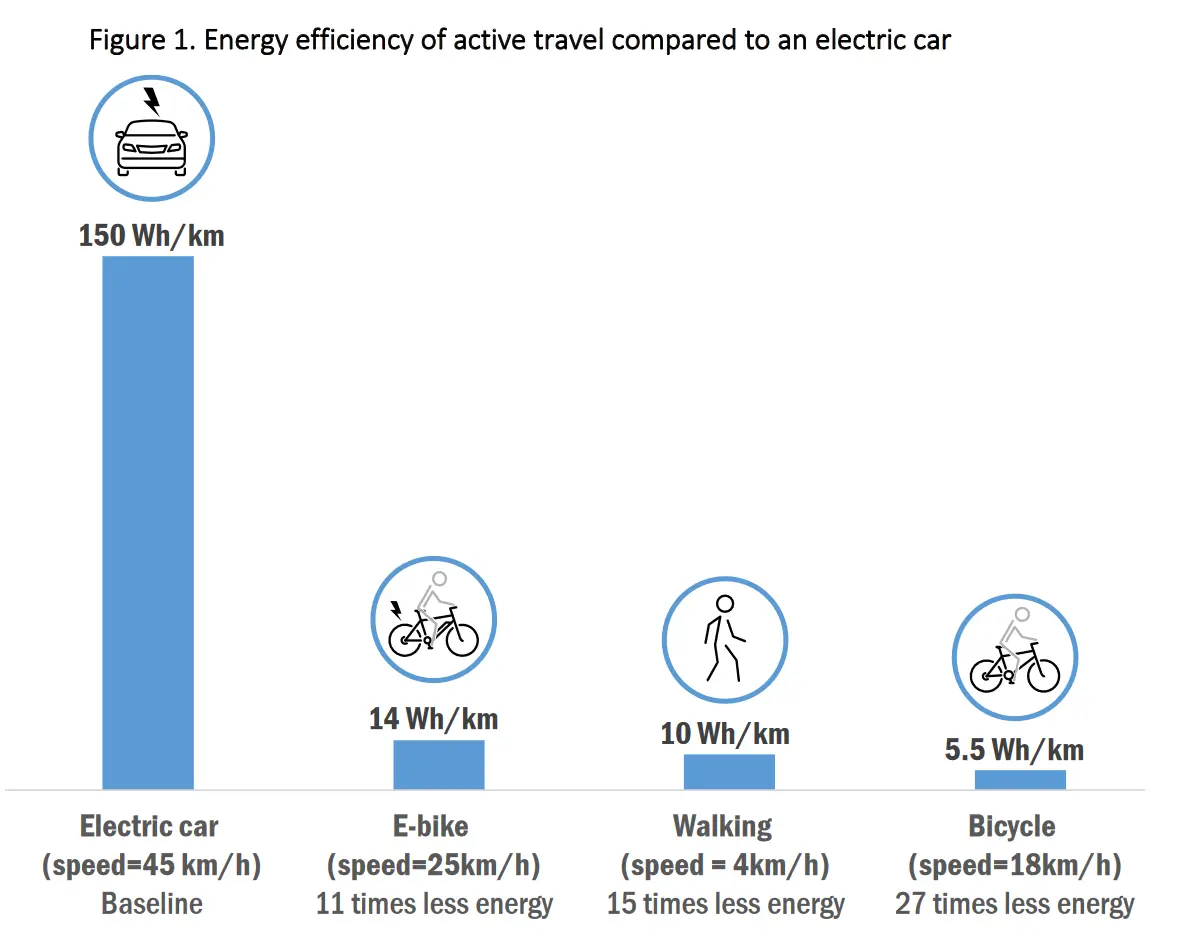
This would be much more efficient if it had other transportation as well.
Like non-electric cars, trains, subways, etc.
It's not too hard to get their efficiency as well.
NEXT DAY EDIT: Should've looked, there's actually a handy chart showing the energy efficiencies of a whole bunch of vehicles and modes of transport just straight up on Wikipedia. This article. Comparing the km/MJ column, we can see:
Walking 4.55
Velomobile with enclosed recumbent: 12.35 (there wasnt a figure for just regular biking)
Solar car: 14.93
Tesla Model 3: 1.76
General Motors EV1: 1.21
All combustion engines are below 1, but here's a few:
VW Passat: 0.33 Cadillac CTS-V: 0.17 Renault Clio: 0.42
There's a whole bunch of other stats though so I suggest checking the table
END EDIT